This is part II of IV of a rebuttal/review of 'The Spirit Level' by Richard Wilkinson and Kate Pickett. If you haven't already read Part I you can find it here.
Part Two: The Costs of Inequality
In Part Two of the book, Wilkinson and Pickett go on to look at each of their indicators of health and social problems in turn and consider whether they are individually correlated with income inequality.
Chapter 4: Community life and social relations
In chapter 4, the authors look at the relationship between income inequality and general levels of ‘trust’ within a society and find that the two are correlated. Putting aside any reservations we may have about how exactly we measure ‘trust’ in any objective or meaningful way, this is an unsurprising finding; it does not mean that the causality necessarily runs from income inequality to low levels of trust. The causality could plausibly run either or both ways here; it’s easy to imagine how inequality of incomes could cause low levels of trust and vice-versa and it could be a self-reinforcing loop. Wilkinson and Pickett present no evidence for the direction of causality or indeed that this is a causal relationship at all.
Christopher Snowdon addresses this point in Chapter 3 of ‘The Spirit Level Delusion’ where he also shows that the apparent trend between ‘trust’ and income inequality is entirely due to the four Nordic countries: Norway, Sweden, Denmark, and Finland having much higher reported levels of ‘trust’ than anywhere else. There is no trend across all of the other rich countries of the World, which suggests this has nothing to do with income inequality, but is far more likely due to something else particular to these four countries.
Later in the same chapter, Snowdon also shows that there is no correlation between income inequality and average unemployment over the 10 year period 1995 - 2005 across wealthy countries. Neither is there any correlation with the Economist Intelligence Unit’s Quality-of-Life Index. As he sums up:
“If more equal countries ‘almost always do better’ we would expect to see evidence of it here. That we do not is a serious blow to the inequality hypothesis.”
Chapter 5: Mental health and drug use
In chapter 5, the authors turn to mental illnesses and find that the prevalence of mental illness is correlated with income inequality between the 12 countries for which suitable data is available. However, they note that looking at differences between US states there is no such correlation to be found for adult males (and they report only weak correlations for adult women and for children).
Given that Wilkinson and Pickett themselves note the absence of correlation for the US data, and given that for the international comparisons ‘suitable data’ is only available for 12 countries (small sample error?) I think that the authors have here fallen victim to the hasty generalisation fallacy (see also here for a good explanation). Whilst the data they present is indicative that there may be some relationship between income inequality and prevalence of mental illness, I don’t think it’s sufficient to draw any concrete conclusions from. I think in their eagerness to show that all manner of ‘bad things’ are correlated with income inequality, Wilkinson and Pickett have here failed to remain objective observers of the evidence. I think also that this has the potential to undermine some of their other points, which may have more merit to them.
To be clear, I’m not claiming that there isn’t a relationship between income inequality and the prevalence of mental illness in a society. Rather, I am claiming simply that Wilkinson and Pickett have not provided sufficient evidence to draw any firm conclusion that there is such a relationship.
In Chapter 2 of ‘The Spirit Level Delusion’, entitled ‘Messing with our minds’, Christopher Snowdon scrutinises the claim put forward by Wilkinson and Pickett in ‘The Spirit Level’ that “Rates of mental illness are five times higher in the most unequal countries compared to the least unequal countries”, along with similar claims made by others.
He writes that Wilkinson and Pickett first produced what would eventually appear in a slightly augmented form as Figure 5.1 in ‘The Spirit Level’ (p. 67) for psychologist Oliver James’s 2007 book ‘Affluenza’. Snowdown notes that this graph first appeared in a preliminary study published in an epidemiological journal in 2006, it is available online here. I have included a copy of the original graph below.
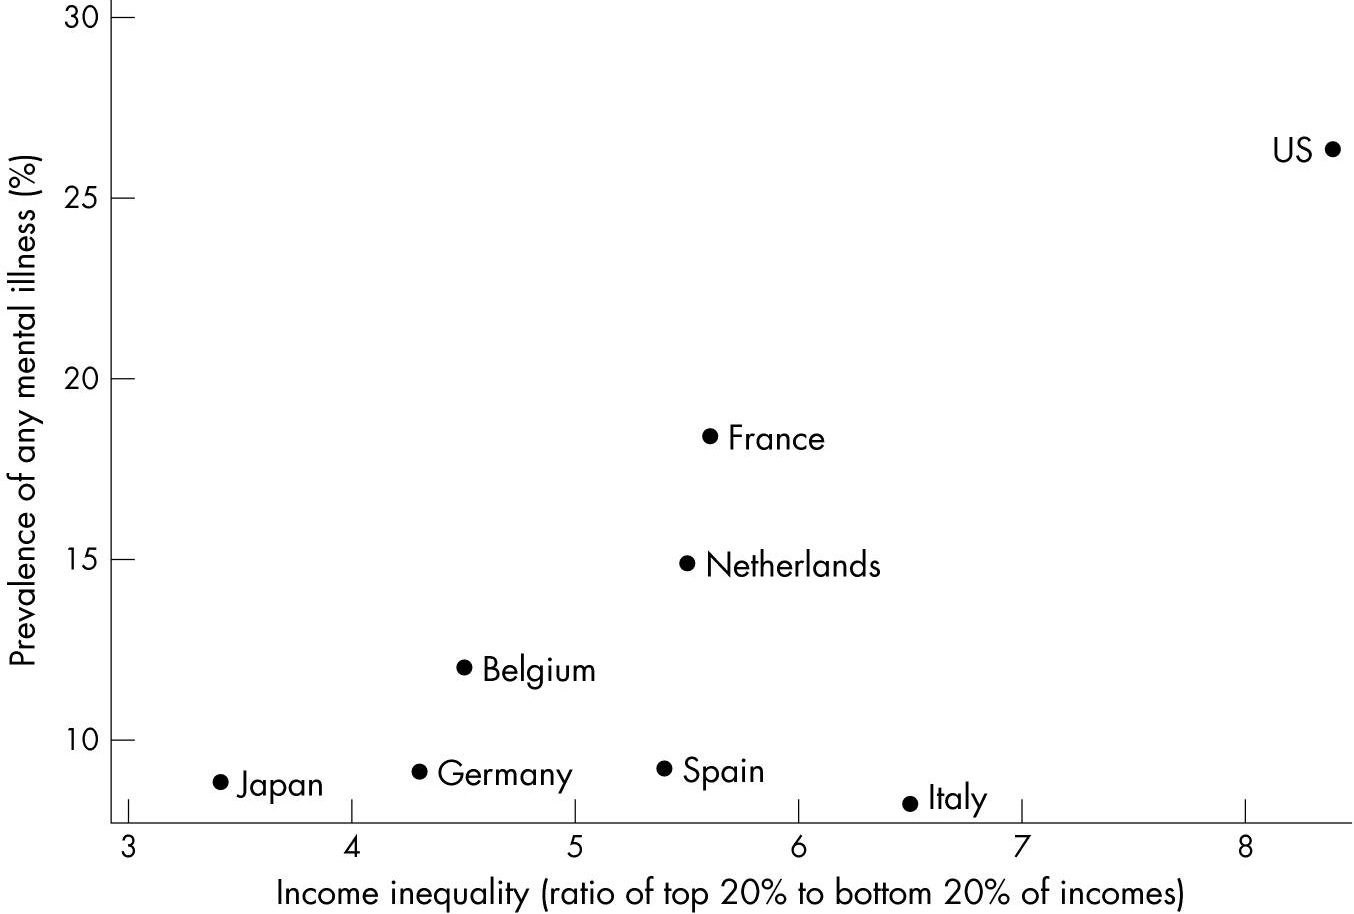
Figure 5.1 in ‘The Spirit Level’ differs only slightly from the above graph. The main change is that for ‘The Spirit Level’ Wilkinson and Pickett have included on the chart the figures for Australia, Canada, New Zealand, and the UK.
Snowdon points out that:
“Gauging rates of mental illness is hampered by the failure of many countries to collect or publish reliable data. Only a handful of nations – notably Germany and the USA – produce useable data and at least a dozen EU countries, including Portugal, Ireland and Greece, produce nothing at all.”
As a result Wilkinson and Pickett, somewhat understandably, used figures from various different sources to compile their graph.
Snowdon then goes on to discuss where the figures that have been used to generate this graph have come from. The figures for all of the European countries – with the notable exception of the UK – came from a 2004 study from the World Mental Health Survey Consortium (WMH), set up by the World Health Organisation (WHO). Snowdon points out that there was another WHO project known as the International Consortium in Psychiatric Epidemiology (ICPE), which came up with very different figures just one year earlier. For example, prevalence of mental health disorders in the Netherlands was estimated at 23.3% according to the ICPE, but 14.9% by the WMH. For Germany, the figures are 24% from the ICPE, but 9.1% from the WMH (and 31% in the ‘German Health Interview and Examination Survey’).
As summarised by Snowdon:
“The EU average for mental disorder prevalence, based on evidence from 27 studies and 16 countries, is 27%. Studies of Western European nations have found rates of mental disorder in the range of 20-40%. In the WMH study, however, the range is half of that: 8-19%. In short, the WMH study appears to underestimate the prevalence of mental disorders in Europe. It is inconsistent with nationwide studies produced at around the same time and with the ICPE survey.”
Later, he continues:
“Note that only Europe was affected – the ICPE and WMH give similar estimates for the USA and Mexico.
This is highly significant because Wilkinson and Pickett rely entirely on the WMH study for their European figures. All the figures from the less-equal English speaking nations are drawn from elsewhere. At the very least this is comparing apples with oranges. Although there are simply not enough studies for us to compare rates of mental illness with any confidence, a reasonably approach would be to exclude the WMH figures and look at the rest. If we do this, a very different picture emerges...”
That picture is one of broad similarity between different countries and of a total lack of a trend between income inequality and the prevalence of mental disorders:
“The most striking feature of the literature on psychiatric epidemiology is how little variation exists from country to country.”
Snowdon cites the Nordic countries as counterexamples to Wilkinson and Pickett's ‘inequality’ explanation and points out that Finland has an estimated rate of clinical depression that is higher than that in either the US or Canada, and is above the EU average. And that “Sweden and Norway hold the dubious honour of having the highest rates of alcoholism in Europe.”
At the end of Chapter 5 of ‘The Spirit Level’, Wilkinson and Pickett consider illegal drug use in rich countries, and again find a correlation with income inequality. They hypothesise that the link between income inequality and mental illness/drug use is being driven by status effects. People who earn much less than the average in a society are, in general, perceived – and more importantly perceive themselves – as low status. Their low income, as a marker of low social status, it is suggested, erodes their self-esteem and self-confidence and leads to them being more likely to develop various neurological disorders, such as depression, anxiety and ADHD. It also makes them more likely to consume illegal drugs in an attempt to ‘self-medicate’ against their feelings of low status and inferiority. This is certainly a plausible narrative; it’s a shame for Wilkinson and Pickett’s thesis that they just don’t present a lot of strong evidence to back it up.
A common theme that I picked up on, running through chapters 3 and 5 is that the explanation favoured by Wilkinson and Pickett for these social problems, namely inequality of income, in fact takes a bit of a back seat to an alternative, but not wholly unrelated, explanation: social inequality (or inequality of status) and hierarchy. This is illustrated by the example of the Wake Forest School of Medicine monkey experiment discussed at the end of chapter 5. The macaques in the experiment have no concept of money or income, but they do have a concept of social status and hierarchy.
This point is picked up on by Christopher Snowdon in the final chapter of ‘The Spirit Level Delusion’, titled ‘The Spirit Level fallacy’:
“The desire of status is not unique to modern society, nor is it even unique to human beings. Wilkinson and Pickett, along with Marmot and Layard, refer to studies of monkeys and baboons competing for status, but these studies only serve to remind us that the desire of status is innate, instinctive and inevitable. Whatever else these primates are fighting over, it is not money.”
Chapter 6: Physical health and life expectancy
In chapter 6 the authors consider the material and psychosocial determinants of health. They discuss the ‘epidemiological transition’, which describes the shift, in wealthy industrialised countries, when infectious diseases (e.g. tuberculosis, malaria) were replaced as the major causes of death by chronic diseases linked to lifestyle factors (e.g. heart disease, cancer).
The authors also discuss the Whitehall I and Whitehall II studies. These were long-term follow-up studies of civil servants to investigate the causes of heart disease and other chronic illnesses. These studies found an inverse association between position in the civil service hierarchy and death rates from heart disease as well as some cancers, chronic lung disease, gastrointestinal disease, depression, suicide, sickness absence from work, back pain, and self-reported health.
Wilkinson and Pickett point out that whilst those in lower status jobs were more likely to be obese, to smoke, to have higher blood pressure, and be less physically active, these differences account for only around one third of their increased risk of death from heart disease.
The factors which seem to make the biggest difference are considered to be job stress and people’s sense of control over their work. Other factors which the authors identify as having a significant impact include our happiness, whether we’re optimistic or pessimistic, and whether we feel hostile or aggressive towards others. The authors also mention the importance of social support and networks of friends and family and how important they are in determining people's overall health and wellbeing.
So far, so good as far as chapter 6 is concerned – I have no beef with any of this.
They go on to look at 77 neighbourhoods of Chicago and find a strong negative correlation between homicide rates and average male life expectancy at birth, considering all causes of death except homicide. In other words, in the most violent neighbourhoods (those with the highest murder rates) the men who aren’t murdered also tend to die younger from other causes than those in less violent neighborhoods. This is, I think, an uncontroversial and a not very surprising finding.
Wilkinson and Pickett then show (Figure 6.2, p. 80) that there’s a lack of correlation between health expenditure per person in absolute terms and life expectancy, across the rich countries studied. They then ask:
“If average levels of income don’t matter, and spending on high-tech health care doesn’t matter, what does?”
This is a good question. The answer they offer is – unsurprisingly – income inequality. They back this up with four graphs depicting the correlations observed between income inequality and life expectancy and between income inequality and infant mortality rates, across rich countries and across US states (Figures 6.3 to 6.6, pp. 82-83).
In chapter 1 of ‘The Spirit Level Delusion’, entitled ‘Bad for our health?’, Christopher Snowdon challenges the supposed link that Wilkinson and Pickett claim to have found between income inequality and life expectancy in developed countries:
“Wilkinson's 1992 article in the British Medical Journal inspired a flurry of research, and in The Spirit Level, the authors refer to a ‘vast literature’ on the subject. There is, however, no mention of how much of this vast literature was written by Wilkinson himself, nor that much of the rest was critical of his theory.
His BMJ study was debunked at length in the same journal in 1995 by Ken Judge. Judge pointed out numerous errors in Wilkinson's research, including the use of ‘inappropriate’ data. He criticised Wilkinson for using the lowest 70% of families as a measure of inequality when a more conventional measure is the bottom 10% or 20% of individuals. ‘The suspicion,’ wrote Judge ‘must be that the choice is derived from the data’ (ie. Wilkinson was cherry-picking). When Judge recalculated the data based on the more usual measure of income per head, the association between life expectancy and inequality disappeared.
His BMJ study was debunked at length in the same journal in 1995 by Ken Judge. Judge pointed out numerous errors in Wilkinson's research, including the use of ‘inappropriate’ data. He criticised Wilkinson for using the lowest 70% of families as a measure of inequality when a more conventional measure is the bottom 10% or 20% of individuals. ‘The suspicion,’ wrote Judge ‘must be that the choice is derived from the data’ (ie. Wilkinson was cherry-picking). When Judge recalculated the data based on the more usual measure of income per head, the association between life expectancy and inequality disappeared.
Judge concluded:
‘In retrospect, it seems extraordinary that a predominantly monocausal explanation of international variations in life expectancy should ever have been regarded as plausible. It is much more likely that they are the product of many influences, which probably interact over long periods of time.’”
That’s a pretty damning review.
Snowdon also cites a ‘large study of wealthy European countries’ from 2002, which ‘showed no association between inequality and life expectancy’.
The study referenced is ‘Income inequality, the psychosocial environment, and health: comparisons of wealthy nations’ by Lynch et. al. published in the Lancet in 2001 and available here.
The interpretation of this study’s findings given on the Lancet’s website is as follows [emphasis added]:
“Income inequality and characteristics of the psychosocial environment like trust, control, and organisational membership do not seem to be key factors in understanding health differences between these wealthy countries. The associations that do exist are largely limited to child health outcomes and cirrhosis. Explanations for between-country differences in health will require an appreciation of the complex interactions of history, culture, politics, economics, and the status of women and ethnic minorities.”
In short, attributing the differences in life expectancy and other health outcomes between rich countries to differences in income inequality alone is overly simplistic and naive at best.
This would fall into what economist Arnold Kling, blogging at askblog, refers to as an ‘unwinnable argument’, which he defines as:
“In general, an unwinnable argument about causality is any argument in which one tries to affirm that X is the sole cause of Y or that X is not at all a cause of Y under circumstances of high causal density.”
The example Professor Kling uses is that of the high incarceration rate of young, African-American males. Considering his three-axis model, he states:
“Progressives, conservatives, and libertarians each have a desired cause for this.
Progressives: racism in the criminal justice system
Conservatives: high propensity of young African-American males to commit crimes
Libertarians: the war on drugs”
There is a lot of wisdom in his claim that [original emphasis]:
“...trying to argue that one of these is the cause is an unwinnable argument. Each of these causal forces has an element of truth, or at least plausibility. The chances are slim of coming up with an empirical analysis that decisively rules in favor of one cause and rules out all other causes.”
Kling goes on to make two further claims [original emphasis]:
“1. When there is a desired cause... chances are the issue involves an unwinnable argument.
2. If your objective is to win an unwinnable argument, then you will tend to engage in normative sociology. To turn your desired cause into the cause, you have to filter out evidence that might support another causal factor and only discuss evidence that supports your desired cause.”
He then concludes that [emphasis added]:
“...it is counterproductive to try to win an unwinnable argument. It is almost as counterproductive to try to reason with someone who is convinced that they can win an unwinnable argument.
I am not saying that it is counterproductive to try to make an argument for or against something being a causal factor. However, I think that it does help to keep in mind that when a desired causal factor is involved it is challenging to remain objective in assessing the evidence.”
Snowdon continues:
“In The Spirit Level, Wilkinson and Pickett cite a 1996 editorial from the BMJ which discussed the ‘big idea’ that ‘the more equally wealth is distributed the better the health of that society’. At that time the BMJ was broadly supportive of the theory but research into it was still in its infancy. Wilkinson and Pickett do not mention the editorial that appeared in the same journal six years later which concluded:
‘Now that good data on income inequality have become available for 16 Western industrialised countries, the association between income inequality and life expectancy has disappeared.’”
Alex Tabarrok discusses the apparent relationship between health and wealth, commenting on the seven-part documentary series ‘Unnatural Causes: Is Inequality Making Us Sick?’ he references recent research by David Cesarini, Erik Lindqvist, Robert Ostling and Bjorn Wallace:
“Wealthier people are healthier and live longer. Why? One popular explanation is summarized in the documentary Unnatural Causes: Is Inequality Making us Sick?”
‘The lives of a CEO, a lab supervisor, a janitor, and an unemployed mother illustrate how class shapes opportunities for good health. Those on the top have the most access to power, resources and opportunity – and thus the best health. Those on the bottom are faced with more stressors – unpaid bills, jobs that don’t pay enough, unsafe living conditions, exposure to environmental hazards, lack of control over work and schedule, worries over children – and the fewest resources available to help them cope.
The net effect is a health-wealth gradient, in which every descending rung of the socioeconomic ladder corresponds to worse health.’
The net effect is a health-wealth gradient, in which every descending rung of the socioeconomic ladder corresponds to worse health.’
If this were true, then increasing the wealth of a poor person would increase their health. That does not appear to be the case. In important new research David Cesarini, Erik Lindqvist, Robert Ostling and Bjorn Wallace look at the health of lottery winners in Sweden (75% of winnings within the range of approximately $20,000 to $800,000) and, importantly, on their children. Most effects on adults are reliably close to zero and in no case can wealth explain a large share of the wealth-health gradient:
‘In adults, we find no evidence that wealth impacts mortality or health care utilization, with the possible exception of a small reduction in the consumption of mental health drugs. Our estimates allow us to rule out effects on 10-year mortality one sixth as large as the crosssectional wealth-mortality gradient.’
The authors also look at the health effects on the children of lottery winners. There is more uncertainty in the health estimates on children but most estimates cluster around zero and developmental effects on things like IQ can be rejected (“In all eight subsamples, we can rule out wealth effects on GPA smaller than 0.01 standard deviations”). Overall for children:
‘Our results suggest that… the effect of permanent income on children’s outcomes is small. With the exception of obesity risk, we estimate precise zero or negative effects in subpopulations for which theories of child development predict larger benefits of wealth… The small impact of wealth on proxies for parenting behavior may explain why the shocks to permanent income appear to have few discernible intergenerational impacts.’
One point to note is that they are looking primarily at children born prelottery although they do not find any health effects in infants born postlottery.
As the authors note, Sweden is an affluent society with an extensive social safety net. Nevertheless, there is still a significant health-wealth gradient in Sweden. We might get larger causal estimates of wealth on health elsewhere but the Swedish results bound how far we can reduce the gradient.
The bottom line: Is inequality making us sick? No.”
Chapter 7: Obesity: wider income gaps, wider waists
In chapter 7 of ‘The Spirit Level’ the authors consider obesity and how the prevalence of overweight and obese individuals has increased in rich countries over recent decades.
They identify positive correlations between obesity in adults and being overweight in children with income inequality across rich countries and US states.
This also ties-in to the discussions in previous chapters, particularly chapter 6, about stress and its impact on the body. For example, stress can cause some people to comfort eat (or conversely, cause some people to lose their appetite). Stress may also have an impact on the unborn child of a pregnant woman, with effects that may persist throughout that child’s life.
Wilkinson and Pickett believe that there is a causal relationship between income inequality and the prevalence of overweight and obese people. The evidence which they cite for this is that:
- It is not due to poor nutritional knowledge among the uneducated. In a survey, 84% of middle-aged British women knew that they should be eating 5 portions of fruit and veg per day. Another study found obese people were better than thin people at guessing the calorie content of snack foods.
- Studies which ask people to subjectively describe their place in the social hierarchy. Obesity was found to be strongly linked to people's subjective sense of status. In the words of Wilkinson and Pickett: “...obesity was more strongly related to people’s subjective sense of their status than to their actual education or income.”
- After the fall of the Berlin Wall, inequality increased in the former East Germany and this was followed by increases in the BMI of children, young adults and mothers.
The first two points above are not actually evidence in favour of the existence of a causal link between income inequality and the prevalence of overweight / obese individuals. Rather, point I. is evidence against one of many possible alternative explanations: That it is due to poor nutritional knowledge of poor people. And point II. is evidence of a link between people’s self-perceived social status and overweight / obesity prevalence, not of any link between the latter and income inequality.
The third piece of evidence that Wilkinson and Pickett cite, that BMI in children, young adults and mothers in the former East Germany increased after an increase in (income) inequality following the fall of the Berlin wall, strikes me as a rather weak argument.
The 2001 study which they cite, by Hesse, Voigt et. al. published in the Journal of Pediatrics noted that there were increases in height over the same time period as the increases in weight and BMI were observed. It seems likely that these changes were driven in large part by improved nutrition in the former East Germany after the fall of the wall. Indeed, the authors’ conclude:
“The results show that the change in socioeconomic conditions was associated with alteration in anthropometric measures within a short period. This may have been caused by changes in the nutrient supply and composition as well as reduced physical activity.”
The fact that nutrition improved in the former East Germany after the fall of the Berlin Wall and that children were both taller and less skinny as a result is something to be celebrated, not disparaged or feared.
Furthermore, the main reason inequality increased in the former East Germany after the fall of the Berlin Wall was that many of the residents were becoming richer due to liberalisation of the economy and trade rules and increasing trade with ‘the West’. With the dissolution of the iron curtain, people were also more able to flee the Soviet administered communist East to the more market-oriented West.
The paper that Wilkinson and Pickett cite for rising inequality in the former East Germany after the fall of the Berlin Wall is: B. Martin, ‘Income inequality in Germany during the 1980s and 1990s’, published in the Review of Income and Wealth (2000) 46 (I):1-19. I found a version online here, it costs $38 for the PDF, sadly I can’t find a version that’s available for free.
Here’s an excerpt from the abstract which caught my attention [emphasis added]:
“While income inequality in West Germany has generally not altered in an economically relevant way over the period 1985 to 1996, inequality in East Germany has increased after reunification. Despite this increase, inequality remains substantially higher in the western part of the country. Convergence of eastern mean income to the western level generally overcompensated the rise in inequality in East Germany, so that the level of inequality in unified Germany is lower in 1996 than in 1990.”
This neatly illustrates an important consideration to bear in mind when looking at any statistics pertaining to inequality (or any statistics, really). That is, whether or not any statistic appears to show inequality rising or falling or staying more-or-less constant depends in large part on how you subset the data. Where and how you go about slicing and dicing the data will affect what that data appear to show. This is well known in statistics circles, and statisticians have a name for it: Simpson’s paradox.
Look only at West Germany over the period 1990 to 1996 and you would conclude that inequality is neither rising nor falling; look only at East Germany over the same period and you’d conclude that inequality is rising; look at the whole of Germany and you’ll conclude that inequality is falling.
Which of these stories is ‘true’?
The answer is they all are, but all of them are only an extremely narrow glimpse at the whole picture, as is any statistical measure. The famous apocryphal line: “There are three kinds of lies: lies, damned lies, and statistics.” contains far more wisdom than is often appreciated.
In chapter 1 of ‘The Spirit Level Delusion’, entitled ‘Bad for our health?’, Christopher Snowdon scrutinises the evidence Wilkinson and Pickett put forward in support of their claim of a link between income inequality and obesity. Wilkinson and Pickett use data from the International Obesity Task Force (IOTF). Snowdon points out that:
“The IOTF does not have the resources to collect its own data and instead relies on individual epidemiological studies carried out by different researchers, using different methodologies over a period of many years. They are by no means definitive.”
He cites the IOTF’s figure for Sweden, which was based on data from just one city, and their 30% figure for Greece, based on a limited age group, which has since been abandoned in favour of a figure of 17.5%.
As Snowdon observes:
“This gives an indication of how much statistics can fluctuate depending on study design.”
I would caution against reading too much into these findings.
Chapter 8: Educational performance
In chapter 8, Wilkinson and Pickett look at education and the relationship between income inequality and educational performance and attainment.
Unsurprisingly, they find a negative correlation between income inequality and the average maths and literacy scores for 15-year-olds, both across rich countries and across US states. They also find a strong positive correlation between income inequality and high school dropout rates across US states.
The authors also look at children’s literacy scores and how they vary with the parents education levels across just 4 countries (small sample error again?): Finland, Belgium, the UK and the USA. They find, again unsurprisingly, that the children of more educated parents score better than those of less educated parents and that this holds true across the 4 countries. They also note four other points of significance:
- Even if your parents are well educated, the country you live in makes a difference to your educational success.
- For those lower down the educational scale, the country they live in makes a bigger difference than for those at the top.
- The social gradient of this effect is steeper in less equal countries (the UK & the USA) than in more equal ones (Finland & Belgium).
- The average scores across the social gradient are higher in more equal countries (Finland & Belgium) than in less equal ones (the UK & the USA).
Wilkinson and Pickett go on to discuss a possible reason for these observations: the quality of family life, particularly in the first few years of life. They then emphasise the importance of early childhood education programmes and suggest a number of other policy proposals, including: generous levels of statutory paid parental (maternity & paternity) leave, family allowances and tax benefits, social housing, healthcare, programmes to promote work/life balance, and enforcement of child support payments.
The authors then consider an experiment reported in 2004 by World Bank economists Karla Hoff and Priyanka Pandey, where they took 321 high-caste and 321 low-caste 11 & 12-year-old Indian boys and gave them puzzles to solve. When the boys didn’t know which caste one-another were from, they performed equally well (the low-caste boys actually performed marginally better on average), but once they had all announced their castes to one-another, the high-caste boys did markedly better than the low caste boys at the same tasks. This resulted from a combination of the high-caste boys performing slightly better in the second set of tests and the low-caste boys performing considerably worse (respectively ‘living up to’ and ‘living down to’ expectations).
There have been various other studies with similar findings. Wilkinson and Pickett cite a study by Claude Steele and Joshua Aronson of Stanford and New York Universities respectively, where they found the same effect amongst white and black high-school students in the US. There have been others – there have been lots of studies into ‘stereotype threat’ showing that girls live down to the gender stereotype of not being as good at mathematics as boys when they are primed to think about the fact that they are girls and that such a stereotype exists, but perform equally well without such priming. So it is with low-caste Indian boys, as with black American high-school students, as with otherwise mathematically capable girls.
Wilkinson and Pickett close the chapter with a finding that children in less equal societies are actually more aspirational than those in more equal ones and posit that some of this difference may be accounted for by less skilled work being less stigmatised in more equal societies.
Chapter 9: Teenage births: recycling deprivation
In chapter 9, the authors turn their attention to teenage pregnancy and motherhood rates. They find a correlation between income inequality and births per 1000 women aged 15 – 19 years. They hypothesise that this may be explained by young women in ‘relative poverty’ perceiving motherhood as a “fast lane to adulthood”, when they have limited other options open to them in terms of education or careers, etc.
In chapter 3 of ‘The Spirit Level Delusion’, Christopher Snowdon looks at family relationships, including teenage births, divorce rates, and the proportion of children living in single-parent households, and how they relate to income inequality. He shows that there is not a link between income inequality and divorce rates in rich countries; there may even be an inverse relationship here. Snowdon also shows that there is no correlation between the proportion of children living in single-parent households and income inequality.
There is a correlation between income inequality and teenage birth rates. However, as Snowdon notes, the authors of the UNICEF report from which the figures are taken [emphasis added]:
“...explicitly reject the possibility of a single unifying explanation for why teen birth rates vary, saying ‘teenage birth rates are the result of a complex interplay of forces, and there is no one equation that can adequately explain or predict their outcome.’”
“Wilkinson and Pickett seem unable to look beyond [income] inequality for an explanation… There are many cultural, historical and religious reasons why teen birth rates vary between countries.”
Chapter 10: Violence: gaining respect
In chapter 10, Wilkinson and Pickett examine the link between income inequality and violence, focussing mainly on the relationship of income inequality to homicide rates per million people. They find that the two are correlated.
One point which caught my eye in chapter 10 was Wilkinson and Pickett’s observation that Finland and Singapore have respectively far more and far fewer homicides per million people than would be expected, based on their income inequality levels, if they were to conform to the general trend (Figure 10.2, p. 135). They hypothesise that this may have something to do with the fact that Finland has the highest rate of gun ownership per household and Singapore amongst the lowest (they cite a 1997 UN Firearm Regulation study for the figures of gun ownership [ref. 215]).
According to more recent figures (yes, I know, the link is to Wikipedia, which is not a reliable source), Finland has the 16th highest gun ownership rate per capita on a list of 178 countries – the US has by far the highest rate. Other countries with higher rates of gun ownership than Finland include: Switzerland (4th highest gun ownership rate in the World), Sweden (9th), Norway (10th), France (11th), Canada (12th), Austria (13th) and Germany (15th) – all of which also have lower homicide rates than Finland. Indeed, Switzerland, Norway, Austria and Germany all have lower homicide rates even than Singapore! This suggests that rates of gun ownership do not explain much, if any, of the wide difference in homicide rates seen between Finland and Singapore.
This is also an ad hoc argument being made by Wilkinson and Pickett. Why do they suspect that Finland’s high homicide rate is causally related to the high rate of gun ownership there, but the high homicide rate in the US (which has the highest rate of gun ownership in the World) is because of inequality? If a high rate of gun ownership can explain Finland’s homicide rate then it can go at least part of the way to explaining that of the US. But if it can’t then you have to abandon the thesis that inequality is a primary causal factor when it comes to homicides, a thesis that rests almost entirely on the peculiarly high homicide rate in the US. At the end of the day, Wilkinson and Pickett’s case depends on a single outlier, whilst simultaneously explaining away other contradictory outliers ad hoc.
Chapter 11: Imprisonment and punishment
In chapter 11, the authors look at the relationship between incarceration rates and income inequality and find a very strong positive correlation. They discuss the high rates of incarceration and the harsh prison environment in the US and contrast this with more equal (in terms of incomes) countries such as Japan and the Netherlands. They observe that custodial sentences are more likely to be handed out and these sentences are more likely to be longer in more unequal countries, particularly the United States. They also observe that longer sentences are well known to not be particularly effective at reducing crime or recidivism rates – the more effective deterrent is higher conviction rates.
In chapter 4 of ‘The Spirit Level Delusion’, Christopher Snowdon observes that Wilkinson and Pickett’s case is based on the number of people incarcerated in each country and not on the number of crimes and that if one looks at number of recorded crimes against income inequality one observes a trend in the opposite direction.
Snowdon takes a more sophisticated view than the monocausal one espoused by Wilkinson and Pickett whereby every ‘bad thing’ is caused by income inequality. He goes on to say (p. 76), however:
“None of this should be taken as evidence that equality ‘causes’ crime. The wide variation between Scandinavian countries shows that many factors are at work.”
He continues:
“Wilkinson and Pickett are almost certainly correct when they argue that too many Americans are sent to prison for minor offences. The absurd ‘three strikes and you’re out’ law that exists in two dozen US states has filled prisons with minor offenders serving life sentences. Half of US prisoners are in jail for non-violent offences and America’s obsessive war on drugs is arguably misguided. Many of its prisoners could be freed without a significant increase in crime ensuing.”
Chapter 12: Social mobility: unequal opportunities
In chapter 12, Wilkinson and Pickett consider social mobility and conclude that it is negatively correlated with income inequality, for an admittedly small dataset of only 8 countries (small sample error yet again?).
Something which caught my eye in this chapter was:
“Data from the 1980s and 1990s show that about 36 per cent of children whose parents were in the bottom fifth of the wealth distribution end up in that same bottom fifth themselves as adults, and among children whose parents were in the top fifth for wealth, 36 per cent of them can be found in the same top fifth.”
Bizarrely, Wilkinson and Pickett interpret this as follows:
“Those at the top can maintain their wealth and status, those at the bottom find it difficult to climb up the income ladder, but there is more flexibility in the middle.”
I have an alternative interpretation:
‘Most of those at the top cannot maintain their wealth and status, whilst most of those at the bottom are able to climb up the income ladder, there is even more flexibility in the middle.’
36 per cent, or just over a third, of children whose parents incomes were in the bottom fifth of the distribution also being in the bottom fifth themselves, means that just under two thirds (64 per cent to be precise), or a significant majority, manage to improve their standing and move up into higher quintiles. That is, for every person born into and remaining stuck in the bottom quintile (although many of those will still earn more than their parents in both nominal and real terms), there are (roughly) two who manage to move up the income distribution to a higher quintile.
The exact reverse scenario applies to those born to parents in the top quintile, with almost two thirds of them ending up making relatively less income than their parents (although many of those will still be earn more than their parents in both nominal and real terms).
This suggests a large degree of income mobility. How Wilkinson and Pickett manage to draw the exact opposite conclusion from this data I have absolutely no idea!